Indonesia Most Livable City Index 2022
According to World Bank data from 2021, global urban population growth is projected to keep increasing. The data shows that 57% of the world’s population, including Indonesia, now live in urban areas. This means that more than half of the people on Earth reside in urban areas. City livability depends on how cities can provide safety and security for the peoples, fulfill their basic needs, provide easy access to public services and infrastructure, have a good quality of the environment, better economic, social and cultural conditions, assure citizen’s participation, and others. Some parties measured city livability quantitatively using various criteria, such as OECD Measuring Well-Being, Mercer Quality of Life Index, Monocle Magazine’s Most Livable City Index, NUA Smart Livability Standard in Cities, The EIU Global Livability Survey, Forbes City Livability Ranking, and ADB Creating Livable City which then resulted in the list of most and worst livable cities in the world. These surveys have been globally trusted as a reliable, valid, and recognized index and have become global references. However, none of those surveys put citizen perception as the basis of measurement. They were based on secondary data, statistics, and were reviewed from the perspective of the researcher. None of the surveys had measured city livability based on citizen’s perceptions. While perceptions are quite significant since it describes the real conditions perceived by the peoples.
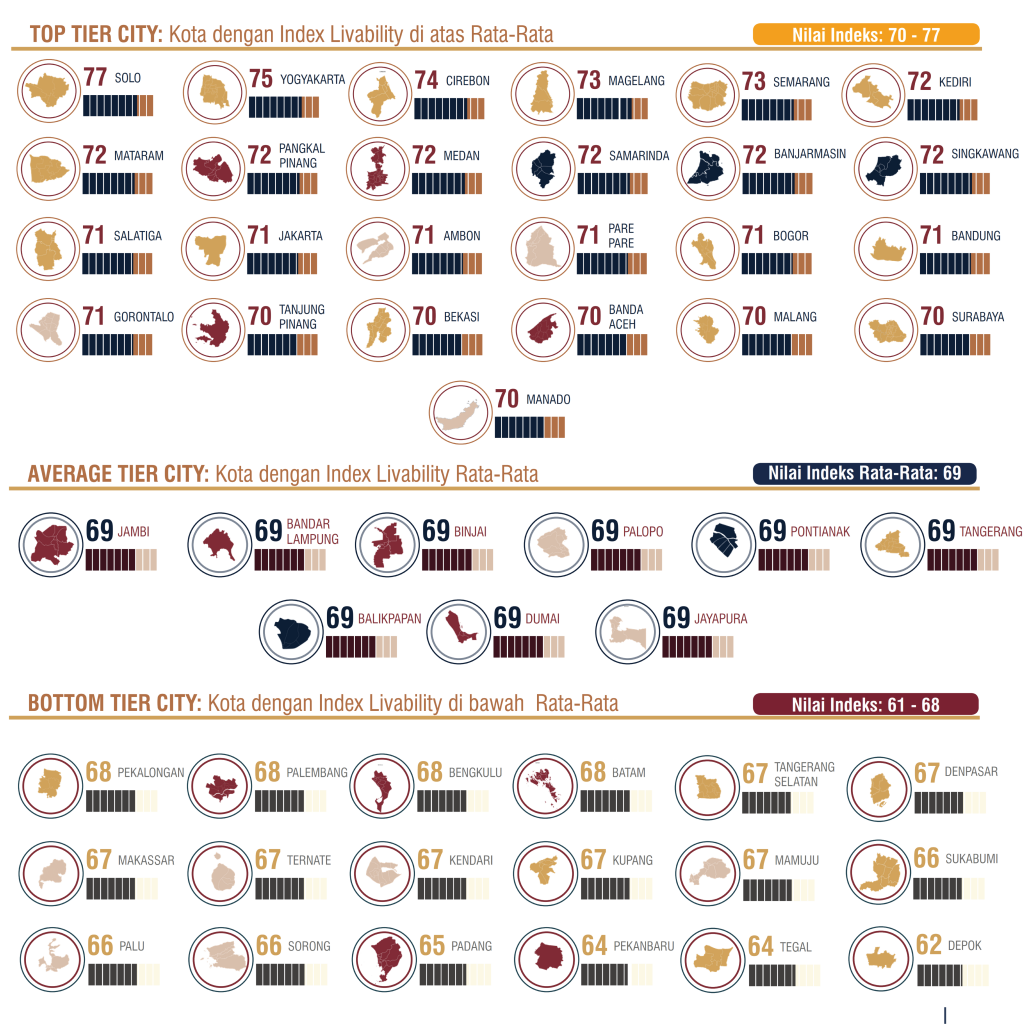
The “Indonesia Most Livable City Index (MLCI)” developed by the Indonesian Association of Planners (IAP) surveys city livability based on citizen’s perceptions. This survey had been carried out since 2009 and was last held in 2022. The indexing measurement was carried out based on 28 assessment criteria developed by the research team. MLCI 2022 surveys 52 cities throughout Indonesia by involving the IAP Regional Office voluntarily as surveyors. The survey resulted that the average livability index of Indonesian Cities was 69 of 100, which indicates that there were still many citizens who feel uncomfortable living in their cities. The survey had also resulted in groups of cities including the top tier cities, average tier cities, and bottom tier cities. Surveys that are held regularly have also been able to show an increase and decrease in the livability index of the city from period to period. In addition, from the survey results, it was found that what aspects were satisfying and unsatisfying according to citizens in each city surveyed. It can be learned that perception can be used to measure the city livability index and is worth considering as one of the legitimate methods of measuring the livability of a city. It can then be used as inputs for government and other stakeholders in terms of providing the citizen’s needs.